The UNDP’s Human Development Index (HDI) is a major achievement. It has focused the world’s attention on the human aspects of development, highlighting and featuring not just economic gains but also schooling and education and life expectancy. In this, it was a hugely important corrective for a development community that tended to have a pure economic growth -focused agenda.
 Over the years the UNDP has also refined the index. Creating alternatives that alongside these core human development factors also feature gender equality, inequality, and, most recently, planetary pressure.
But so far the human development index has not included democracy and democratic governance as part of the features they combine when they measure the amount of human development in a country.
This is perhaps not surprising. Democracy remains contested in international governance and for the United Nations talking clearly and unequivocally positively about democracy is still hard, even though the new sustainable development agenda has made that easier. Luckily for us, as researchers, we do not have to take the hurt feelings and animosity of autocrats and dictatorial regimes into consideration. So we went ahead and built a version of the human development index, inspired by the gender, inequality, and planetary pressure (carbon dioxide emissions per person) versions, which includes democratic government as part of the criteria and recalculated each country’s score and position on the HDI.
Obviously, one amusing aspect of this is to showcase how countries such as China and Saudi Arabia then drop precipitously on our ranking compared to the original HDI. More importantly, however, there are good evidence-based reasons for why democracy should indeed be featured in a human development index.
A large, and growing, literature has shown that living under democratic governance and having democratic institutions facilitates long-term sustainable development, including economic growth. Systematic research has shown that democracies are better at reducing infant mortality than autocracies. And a host of studies have established that democracy definitely does not reduce economic growth and most likely leads to higher growth.
As such, democracy appears as a core fundamental component of long term sustainable human development and a human development index should therefore account for it.
Fixing this is actually quite easy. First we need a measure of democracy. We have access to good data on the extent to which a country is a democratic system from several widely used and acclaimed databases. We turn to the Varieties of Democracy, VDEM, project and their polyarchy index. The polyarchy index focuses on the primacy of elections.
‘The electoral principle of democracy seeks to embody the core value of making rulers responsive to citizens, achieved through electoral competition for the electorate’s approval under circumstances when suffrage is extensive; political and civil society organizations can operate freely; elections are clean and not marred by fraud or systematic irregularities; and elections affect the composition of the chief executive of the country. In between elections, there is freedom of expression and an independent media capable of presenting alternative views on matters of political relevance. In the V-Dem conceptual scheme, electoral democracy is understood as an essential element of any other conception of representative democracy — liberal, participatory, deliberative, egalitarian, or some other.’
The polyarchy index ranks all countries from 0 to 1, where 0 is least democratic and 1 is most democratic. This, then, will be our indicator for democracy. Next, we take this indicator and combine it with the other four HDI indicators — life expectancy at birth, expected years of schooling, mean years of schooling, and GNI per capita — and, using the rules set out in the technical appendix for the HDI for combining these indicators, re-calculate the score for each and every country for 2019, the last year for which we have available data.
Before we take a peek at this new index, one caveat is necessary. The HDI, and similar indices, create an unfortunate illusion of precision. The HDI is defined down to the third decimal point and ranks countries exactly in 1st, 22nd, 75th place and so on and so forth. This approach is perhaps a bit too persuasive and completely neglects the large and inherent uncertainty in the estimation of scores. Instead of focusing on who’s in first and second place it probably makes much more sense, and is much more statistically sober, to focus on which countries cluster towards the top or in other parts of the index.
So what happens? The two maps below show the world according to the original HDI, the first one, and the world according to our democracy-HDI, the second one.
![]() The two maps give a first snapshot at which countries move the most from the original to our new index and if there is any regional clustering. Two tendencies in particular stand out. First, in the set of already highly developed countries, especially in Europe, North America and parts of Asia there are very few changes. These are countries that already scored high on the HDI and who are also democratic. The same also holds for most of South America, although some countries such as Venezuela see deterioration in their scores.
The two maps give a first snapshot at which countries move the most from the original to our new index and if there is any regional clustering. Two tendencies in particular stand out. First, in the set of already highly developed countries, especially in Europe, North America and parts of Asia there are very few changes. These are countries that already scored high on the HDI and who are also democratic. The same also holds for most of South America, although some countries such as Venezuela see deterioration in their scores.
Second, we see the biggest drops in scores across the Middle East and Asia. Fairly rich countries with little or no democratic rule, like many of the Gulf states, fall the most, many of them, like Saudi Arabia, from the top (40th place) towards the bottom (129th place). Similarly, countries such as Russia and China also fall from 40 to 70 places between the two indices. These are countries which do have high, or increasing, levels of material well-being, but where citizens enjoy few or no social and political rights and where human rights abuses, persecution, and repression is widespread. This undermines sustainable development, which is reflected in the countries’ lower score when this is taken into account.
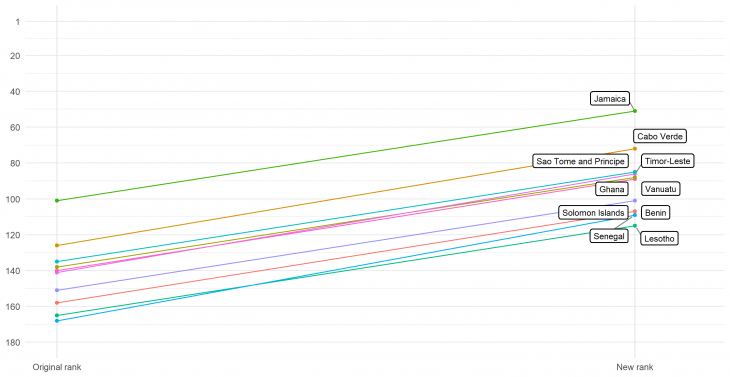
On the other hand, we see the biggest improvements in a set of countries that often score somewhat low on traditional development indicators but where some, with emphasis on some, semblance of democratic governance is respected. These are countries, then, where citizens are very much defying the notion that you have to be a developed country to have democracy. The list includes countries such as Cabo Verde, Ghana, Benin, and Senegal and other countries in Africa, but also Jamaica and Timor-Leste.
No one is saying that democratic institutions in these countries are working perfectly, but they do enjoy some basic democratic values and citizens and incumbents are working hard to improve and defend their democratic institutions. These, then, are countries where the peoples’ rights are, to a much larger extent, respected. And this will serve them well in their efforts toward sustainable development.
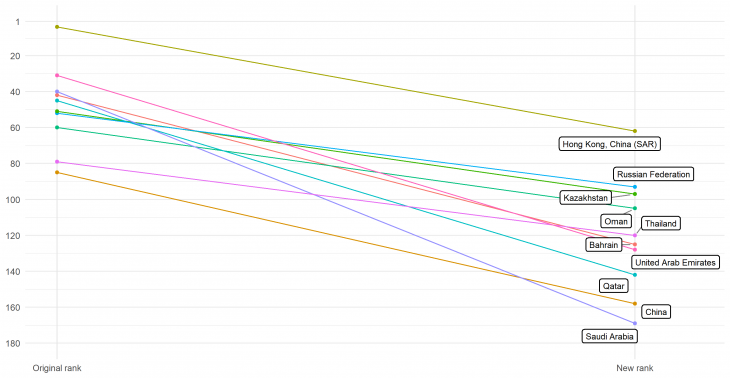
The 10 biggest ‘losers’ and the 10 biggest ‘winners’, going from the old to the new index, are also shown in the figures above (losers) and below (winners).
So what is the utility of all of this? As with the original HDI, this index gives you a snapshot of where the world is on the road to human development, where the biggest challenges are, and which countries are performing better than expected.
This new index also provides some much-needed corrective. A lot of talk in development is focused around the ‘miracle growers’ such as China. More and more research is suggesting, however, that these countries are achieving development in spite of the lack of democracy and that their lack of democratic institutions may undermine long term growth.
A core rational behind the human development index was to center development around people. Democratic governance is the only system of government capable of respecting human rights and individual freedoms over the long run. Democracy enables sustainable growth. This index shows that the answer to the question of what countries achieve sustainable development, changes when democracy is taken properly into account.
Table 1: The Democracy and Human Development Index. The Table reports all countries’ rankings on the original and this new index as well as the original and the new scores. The Table is sorted according to the new scores. Note that a negative value in the ‘rank difference’ column means the country climbed from the original to the new index. Note also that some smaller countries that are included in the original index are not included here.
| Country | Original HDI | Corrected HDI | Original HDI rank | Corrected HDI rank | Rank difference |
| Norway | 0.957 | 0.936 | 1 | 1 | 0 |
| Switzerland | 0.955 | 0.934 | 2 | 2 | 0 |
| Ireland | 0.955 | 0.932 | 2 | 3 | 1 |
| Denmark | 0.94 | 0.93 | 10 | 4 | -6 |
| Sweden | 0.945 | 0.927 | 7 | 5 | -2 |
| Iceland | 0.949 | 0.923 | 4 | 6 | 2 |
| Finland | 0.938 | 0.921 | 11 | 7 | -4 |
| Belgium | 0.931 | 0.919 | 14 | 8 | -6 |
| Germany | 0.947 | 0.917 | 6 | 9 | 3 |
| Australia | 0.944 | 0.916 | 8 | 10 | 2 |
| New Zealand | 0.931 | 0.916 | 14 | 11 | -3 |
| Netherlands | 0.944 | 0.914 | 8 | 12 | 4 |
| United Kingdom | 0.932 | 0.913 | 13 | 13 | 0 |
| Canada | 0.929 | 0.913 | 16 | 14 | -2 |
| Luxembourg | 0.916 | 0.907 | 23 | 15 | -8 |
| Korea (Republic of) | 0.916 | 0.897 | 23 | 16 | -7 |
| Spain | 0.904 | 0.897 | 25 | 17 | -8 |
| France | 0.901 | 0.896 | 26 | 18 | -8 |
| United States | 0.926 | 0.893 | 17 | 19 | 2 |
| Japan | 0.919 | 0.893 | 19 | 20 | 1 |
| Austria | 0.922 | 0.892 | 18 | 21 | 3 |
| Estonia | 0.892 | 0.892 | 29 | 22 | -7 |
| Slovenia | 0.917 | 0.885 | 22 | 23 | 1 |
| Italy | 0.892 | 0.884 | 29 | 24 | -5 |
| Greece | 0.888 | 0.881 | 32 | 25 | -7 |
| Cyprus | 0.887 | 0.875 | 33 | 26 | -7 |
| Czechia | 0.9 | 0.873 | 27 | 27 | 0 |
| Portugal | 0.864 | 0.866 | 38 | 28 | -10 |
| Lithuania | 0.882 | 0.862 | 34 | 29 | -5 |
| Malta | 0.895 | 0.858 | 28 | 30 | 2 |
| Latvia | 0.866 | 0.852 | 37 | 31 | -6 |
| Israel | 0.919 | 0.848 | 19 | 32 | 13 |
| Slovakia | 0.86 | 0.848 | 39 | 33 | -6 |
| Argentina | 0.845 | 0.837 | 46 | 34 | -12 |
| Chile | 0.851 | 0.831 | 43 | 35 | -8 |
| Poland | 0.88 | 0.829 | 35 | 36 | 1 |
| Costa Rica | 0.81 | 0.829 | 62 | 37 | -25 |
| Uruguay | 0.817 | 0.827 | 55 | 38 | -17 |
| Barbados | 0.814 | 0.816 | 58 | 39 | -19 |
| Mauritius | 0.804 | 0.808 | 66 | 40 | -26 |
| Croatia | 0.851 | 0.807 | 43 | 41 | -2 |
| Panama | 0.815 | 0.807 | 57 | 42 | -15 |
| Romania | 0.828 | 0.788 | 49 | 43 | -6 |
| Trinidad and Tobago | 0.796 | 0.783 | 67 | 44 | -23 |
| Armenia | 0.776 | 0.783 | 81 | 45 | -36 |
| Peru | 0.777 | 0.779 | 79 | 46 | -33 |
| Georgia | 0.812 | 0.766 | 61 | 47 | -14 |
| Mexico | 0.779 | 0.761 | 74 | 48 | -26 |
| Singapore | 0.938 | 0.757 | 11 | 49 | 38 |
| Bulgaria | 0.816 | 0.752 | 56 | 50 | -6 |
| Jamaica | 0.734 | 0.752 | 101 | 51 | -50 |
| Hungary | 0.854 | 0.742 | 40 | 52 | 12 |
| Brazil | 0.765 | 0.741 | 84 | 53 | -31 |
| Colombia | 0.767 | 0.74 | 83 | 54 | -29 |
| Suriname | 0.738 | 0.738 | 97 | 55 | -42 |
| Ecuador | 0.759 | 0.737 | 86 | 56 | -30 |
| Sri Lanka | 0.782 | 0.736 | 72 | 57 | -15 |
| North Macedonia | 0.774 | 0.736 | 82 | 58 | -24 |
| Tunisia | 0.74 | 0.735 | 95 | 59 | -36 |
| Seychelles | 0.796 | 0.73 | 67 | 60 | -7 |
| Mongolia | 0.737 | 0.723 | 99 | 61 | -38 |
| Hong Kong, China (SAR) | 0.949 | 0.722 | 4 | 62 | 58 |
| Botswana | 0.735 | 0.718 | 100 | 63 | -37 |
| Montenegro | 0.829 | 0.713 | 48 | 64 | 16 |
| Dominican Republic | 0.756 | 0.713 | 88 | 65 | -23 |
| Bosnia and Herzegovina | 0.78 | 0.709 | 73 | 66 | -7 |
| Malaysia | 0.81 | 0.706 | 62 | 67 | 5 |
| Moldova (Republic of) | 0.75 | 0.705 | 90 | 68 | -22 |
| Albania | 0.795 | 0.701 | 69 | 69 | 0 |
| South Africa | 0.709 | 0.701 | 114 | 70 | -44 |
| Indonesia | 0.718 | 0.697 | 107 | 71 | -36 |
| Cabo Verde | 0.665 | 0.697 | 126 | 72 | -54 |
| Paraguay | 0.728 | 0.694 | 103 | 73 | -30 |
| Ukraine | 0.779 | 0.686 | 74 | 74 | 0 |
| Guyana | 0.682 | 0.68 | 122 | 75 | -47 |
| Bolivia (Plurinational State of) | 0.718 | 0.668 | 107 | 76 | -31 |
| Maldives | 0.74 | 0.667 | 95 | 77 | -18 |
| Lebanon | 0.744 | 0.662 | 92 | 78 | -14 |
| El Salvador | 0.673 | 0.662 | 124 | 79 | -45 |
| Fiji | 0.743 | 0.661 | 93 | 80 | -13 |
| Serbia | 0.806 | 0.659 | 64 | 81 | 17 |
| Namibia | 0.646 | 0.659 | 130 | 82 | -48 |
| Philippines | 0.718 | 0.649 | 107 | 83 | -24 |
| Guatemala | 0.663 | 0.645 | 127 | 84 | -43 |
| Sao Tome and Principe | 0.625 | 0.644 | 135 | 85 | -50 |
| Timor-Leste | 0.606 | 0.64 | 141 | 86 | -55 |
| Kuwait | 0.806 | 0.638 | 64 | 87 | 23 |
| Ghana | 0.611 | 0.636 | 138 | 88 | -50 |
| Vanuatu | 0.609 | 0.634 | 140 | 89 | -51 |
| Turkey | 0.82 | 0.633 | 54 | 90 | 36 |
| Bhutan | 0.654 | 0.628 | 129 | 91 | -38 |
| Belarus | 0.823 | 0.615 | 53 | 92 | 39 |
| Russian Federation | 0.824 | 0.609 | 52 | 93 | 41 |
| India | 0.645 | 0.608 | 131 | 94 | -37 |
| Kyrgyzstan | 0.697 | 0.603 | 120 | 95 | -25 |
| Nepal | 0.602 | 0.603 | 142 | 96 | -46 |
| Kazakhstan | 0.825 | 0.6 | 51 | 97 | 46 |
| Gabon | 0.703 | 0.597 | 119 | 98 | -21 |
| Algeria | 0.748 | 0.595 | 91 | 99 | 8 |
| Iraq | 0.674 | 0.591 | 123 | 100 | -23 |
| Solomon Islands | 0.567 | 0.591 | 151 | 101 | -50 |
| Jordan | 0.729 | 0.572 | 102 | 102 | 0 |
| Iran (Islamic Republic of) | 0.783 | 0.568 | 70 | 103 | 33 |
| Palestine, State of | 0.708 | 0.563 | 115 | 104 | -11 |
| Oman | 0.813 | 0.561 | 60 | 105 | 45 |
| Cuba | 0.783 | 0.559 | 70 | 106 | 36 |
| Benin | 0.545 | 0.559 | 158 | 107 | -51 |
| Libya | 0.724 | 0.555 | 105 | 108 | 3 |
| Senegal | 0.512 | 0.555 | 168 | 109 | -59 |
| Morocco | 0.686 | 0.553 | 121 | 110 | -11 |
| Kenya | 0.601 | 0.552 | 143 | 111 | -32 |
| Honduras | 0.634 | 0.55 | 132 | 112 | -20 |
| Côte d’Ivoire | 0.538 | 0.549 | 162 | 113 | -49 |
| Azerbaijan | 0.756 | 0.546 | 88 | 114 | 26 |
| Lesotho | 0.527 | 0.537 | 165 | 115 | -50 |
| Venezuela (Bolivarian Republic of) | 0.711 | 0.536 | 113 | 116 | 3 |
| Papua New Guinea | 0.555 | 0.536 | 155 | 117 | -38 |
| Myanmar | 0.583 | 0.533 | 147 | 118 | -29 |
| Uzbekistan | 0.72 | 0.529 | 106 | 119 | 13 |
| Thailand | 0.777 | 0.528 | 79 | 120 | 41 |
| Nigeria | 0.539 | 0.528 | 161 | 121 | -40 |
| Viet Nam | 0.704 | 0.525 | 117 | 122 | 5 |
| Angola | 0.581 | 0.525 | 148 | 123 | -25 |
| Zambia | 0.584 | 0.522 | 146 | 124 | -22 |
| Bahrain | 0.852 | 0.52 | 42 | 125 | 83 |
| Madagascar | 0.528 | 0.52 | 164 | 126 | -38 |
| Comoros | 0.554 | 0.519 | 156 | 127 | -29 |
| United Arab Emirates | 0.89 | 0.516 | 31 | 128 | 97 |
| Nicaragua | 0.66 | 0.515 | 128 | 129 | 1 |
| Bangladesh | 0.632 | 0.515 | 133 | 130 | -3 |
| Gambia | 0.496 | 0.513 | 172 | 131 | -41 |
| Liberia | 0.48 | 0.513 | 175 | 132 | -43 |
| Egypt | 0.707 | 0.509 | 116 | 133 | 17 |
| Tanzania (United Republic of) | 0.529 | 0.502 | 163 | 134 | -29 |
| Pakistan | 0.557 | 0.496 | 154 | 135 | -19 |
| Mauritania | 0.546 | 0.495 | 157 | 136 | -21 |
| Haiti | 0.51 | 0.494 | 170 | 137 | -33 |
| Sierra Leone | 0.452 | 0.49 | 182 | 138 | -44 |
| Turkmenistan | 0.715 | 0.487 | 111 | 139 | 28 |
| Malawi | 0.483 | 0.487 | 174 | 140 | -34 |
| Guinea-Bissau | 0.48 | 0.486 | 175 | 141 | -34 |
| Qatar | 0.848 | 0.485 | 45 | 142 | 97 |
| Zimbabwe | 0.571 | 0.481 | 150 | 143 | -7 |
| Cameroon | 0.563 | 0.479 | 153 | 144 | -9 |
| Cambodia | 0.594 | 0.473 | 144 | 145 | 1 |
| Uganda | 0.544 | 0.472 | 159 | 146 | -13 |
| Tajikistan | 0.668 | 0.471 | 125 | 147 | 22 |
| Togo | 0.515 | 0.471 | 167 | 148 | -19 |
| Guinea | 0.477 | 0.468 | 178 | 149 | -29 |
| Congo | 0.574 | 0.466 | 149 | 150 | 1 |
| Afghanistan | 0.511 | 0.464 | 169 | 151 | -18 |
| Rwanda | 0.543 | 0.451 | 160 | 152 | -8 |
| Mozambique | 0.456 | 0.444 | 181 | 153 | -28 |
| Mali | 0.434 | 0.442 | 184 | 154 | -30 |
| Ethiopia | 0.485 | 0.441 | 173 | 155 | -18 |
| Equatorial Guinea | 0.592 | 0.44 | 145 | 156 | 11 |
| Djibouti | 0.524 | 0.439 | 166 | 157 | -9 |
| China | 0.761 | 0.437 | 85 | 158 | 73 |
| Congo (Democratic Republic of the) | 0.48 | 0.436 | 175 | 159 | -16 |
| Eswatini (Kingdom of) | 0.611 | 0.429 | 138 | 160 | 22 |
| Burkina Faso | 0.452 | 0.426 | 182 | 161 | -21 |
| Lao People’s Democratic Republic | 0.613 | 0.41 | 137 | 162 | 25 |
| Sudan | 0.51 | 0.41 | 170 | 163 | -7 |
| Niger | 0.394 | 0.409 | 189 | 164 | -25 |
| Syrian Arab Republic | 0.567 | 0.403 | 151 | 165 | 14 |
| Central African Republic | 0.397 | 0.394 | 188 | 166 | -22 |
| Chad | 0.398 | 0.361 | 187 | 167 | -20 |
| South Sudan | 0.433 | 0.347 | 185 | 168 | -17 |
| Saudi Arabia | 0.854 | 0.346 | 40 | 169 | 129 |
| Burundi | 0.433 | 0.339 | 185 | 170 | -15 |
| Yemen | 0.47 | 0.336 | 179 | 171 | -8 |
| Eritrea | 0.459 | 0.288 | 180 | 172 | -8 |