Remote sensing can provide valuable insights into the environmental dimensions of armed conflicts.
Lashkargāh in Afghanistan. Remote sensing is allowing researchers to gain a better understanding of the influence of armed conflicts on land use than ever before. Credit: Google Earth.
Access to areas affected by armed conflicts is often limited, posing problems for research into environmental change. Because of this, remote sensing using satellite imagery is one of the tools that is increasingly used to monitor how armed conflicts interact with the environment. In this blog, Dr Lina Eklund provides an introduction into what we can discover through remote sensing using examples from Iraq, Syria and the Occupied Palestinian Territories, and considers the limitations of these techniques.
Monitoring environmental change
All around the world, the environment is being affected by human activity. Our consumption of fossil fuels is disrupting the Earth’s climate system. The oceans are filling with plastic. Ecosystems are damaged due to over-fertilisation and pollution, and we have managed to change the make-up of the Earth’s surface itself, turning forests into agricultural areas for large scale production. While these changes are easier to monitor in politically stable contexts, we know very little about how the environment is affected in areas faced by armed conflict, either directly by the conflict, or indirectly through the socio-political conditions that conflicts create.
Conflict can have both negative and unintentionally positive effects on the environment, depending on the nature of the conflict. In Colombia, with the recent end of its 50-year conflict, researchers are documenting increased deforestation and mining activities in areas that had been unintentionally protected by the conflict. On the other hand, environmental damage can be used as a weapon of war. Some examples of this can be seen in how the Islamic State (IS) deliberately contaminated water sources and sabotaged irrigation wells in Iraq.
What we can learn from changes in land use
We can learn quite a lot about certain areas by looking at satellite images. Some of the most interesting areas to look at are border regions. While the climate and geographical features are similar, there are often very visible differences between the different sides of a border, especially in politically sensitive regions. These differences can help provide an indication of how different socio-political conditions can influence the environment.
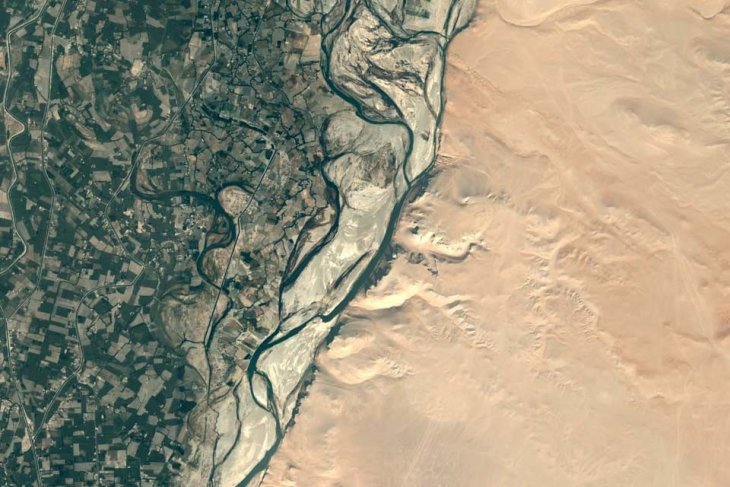
One example of such a difference is the border between Turkey and Syria. On the one side we see large, green agricultural fields. On the other side, smaller and more dispersed agricultural fields that have a grey-green nuance. These differences illustrate the differences between Turkey and Syria’s agricultural systems. While Turkey has spent far more resources on developing irrigation systems and dams, Syria has been less efficient in its water management. Additionally, Turkey is the upstream country and controls the river flow downstream to Syria.
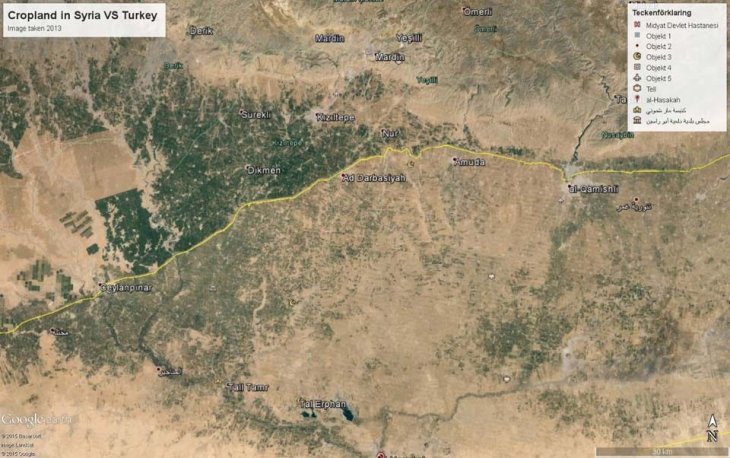
Credit: CEOBS (2019).
Islamic State and agricultural production
A few years ago, I was talking to a friend interested in, and blogging about, Da’esh, or the Islamic State. I wondered if we could use satellite images to learn anything about the terrorist group with state ambitions that had rapidly taken control of large areas of Syria and Iraq. We decided to see if agriculture had changed in extent since Da’esh took over land in 2014 and 2015. The idea resulted in an academic publication about how conflict affects land use.
We found that while some areas certainly had less agricultural activity than was previously the case, other areas had been newly taken under cultivation. When it came to cropland with two harvest periods per year, we found that some areas had been changed to cropland with only one harvest per year, both inside “Da’esh territory” and in the rest of Iraq and Syria. This reduction was, however, less widespread inside Da’esh territory, indicating that Da’esh had been able to better maintain a more intensive type of agriculture, which requires more labour, irrigation and fertiliser inputs. Contrary to what we had expected, in some areas we saw continued, and at times increased, agricultural activity in the areas controlled by Da’esh. These results were valid for 2015, but what has happened after that could be a different story, as indicated by a recent Amnesty International report about destruction of Iraq’s farmland by Da’esh.
Forest loss and gain in Israel and Palestine
Another example of how satellite images can be useful to study conflict is to look at trees and forest vegetation. We often associate conflict with the destruction of natural vegetation, sometimes as an intended method of warfare. However, there are cases where the planting of forests has been used in conflict over land. The Jewish National Fund (JNF) has been planting trees in historical Palestine as a way to claim land for Israelis since the early 20th Century. This reforestation has often happened on land in Palestinian villages abandoned during the conflict in 1948, and there are claims that the purpose of the practice is to remove the traces of Palestinian presence on the.
Credit: CEOBS (2019).
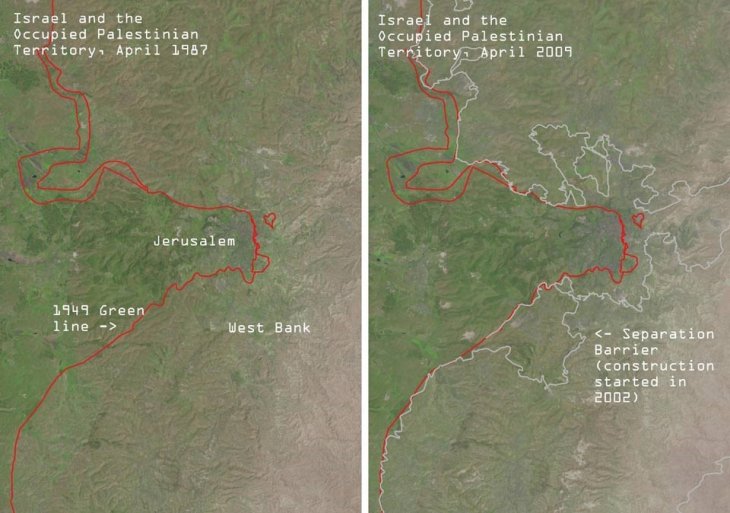
Since this practice goes back to times when there were no satellites, it is difficult to investigate the extent of this using remote sensing alone. However, NASA’s Landsat products let us study developments from the 1980s until today with a 30m pixel size. Above is a comparison of the Jerusalem area in 1987 and 2009. We see that the Israeli side of the 1949 Green Line (displayed in red) has many green areas with forests, while on the eastern side of the line, the Palestinian West Bank, seems to have fewer wooded areas.
Whatever the cause, we see that Palestinians are living in areas with fewer trees and green areas, and Israelis are living in areas with more trees and green areas. The difference between the two sides of the Green line is quite clear, both in 1987 and in 2009. The “Separation Barrier” that started to be built in 2002 serves as the “de facto” border that separates Israel and the Occupied Palestinian Territory, but it is difficult to tell any difference in the area located between the Green Line and the Separation Barrier.
Forest loss in Iraqi Kurdistan
Forests can also be lost as a direct and indirect effect of armed conflicts. Media reports state that the war against Da’esh in Iraq has indirectly led to de-forestation in Iraqi Kurdistan, a mountainous area with large woodlands and forests. The combination of fuel shortages during winter, and the need for forest rangers to join the fight against Da’esh, have reportedly led to forest loss in the region.
A quick analysis of the same land cover dataset I used for the study of agriculture in Da’esh territory shows that after 2014, the “non-cropland vegetation” in the Kurdistan Region of Iraq, aka woodlands, shrublands, pastures, and orchards, had decreased by approximately 20% by 2016. The data indicated that most of these areas had seen a conversion to cropland vegetation, and not bare soil as would be expected. Questions remain about whether these changes are connected to the reported deforestation linked to conflict, but the decline in forest and other vegetation does coincide with the years of conflict.
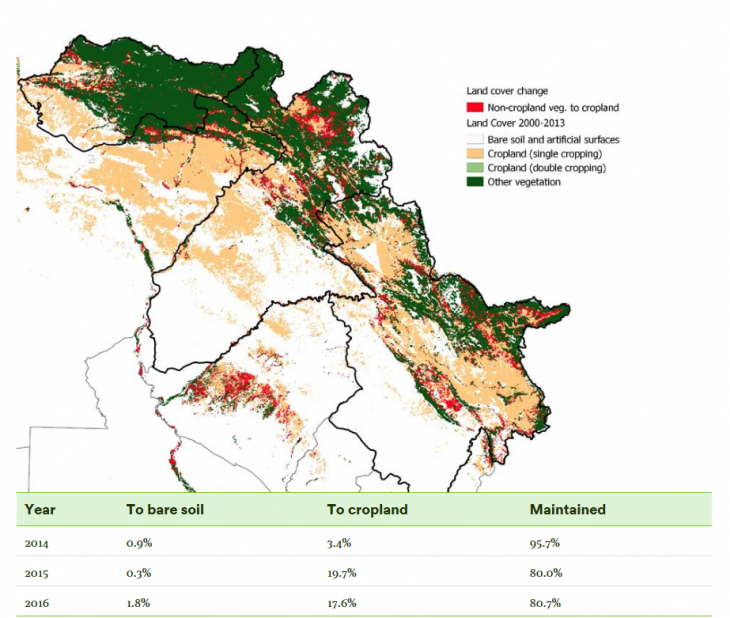
Credit: CEOBS (2019).
Having a go yourself
So, how do you access these satellite images that might be helpful to study conflicts? There are many satellite products that are accessible, depending on your knowledge of remote sensing. One of the good things about remote sensing is that many of the satellite products are freely available, even though some high-resolution imagery costs . If you have no previous knowledge of Geographical Information Systems (GIS) or remote sensing, you can start by exploring Google Earth. There you can pan around and zoom in to areas you’re interested in. You can also go back in time and look at historical images to compare different time periods. Google Earth, however, is mainly for visual analysis and limited to certain datasets , for example time periods can be restricted for politically sensitive areas.
If you have some technical skills and are interested in larger areas, you can use EarthExplorer, which is provided by the US Geological Survey, to either look at images (such as those from Landsat) using the web interface, or download and open them with GIS software. A good, free open source option is QGIS. Carrying out more quantitative analyses, for example time series or land cover classification, requires a better understanding of the principles of remote sensing, together with the technical knowledge of spatial analysis. Google Earth Engine is a new and promising tool for analysing large amounts of satellite data, and there are several tutorials to help you get started.
Studying and analysing satellite images can give us information about when, where and how much, but it doesn’t tell us about who and why. For this we need to make use of other types of information, like local media reports, or interviews with people who know the area. While satellite images can be helpful in studying conflicts, both in time and space, we need to be careful about the conclusions we draw from them, and perhaps use them to ask new questions rather than seeing them as answers.
Dr Lina Eklund is Assistant Professor at the Department of Planning, Aalborg University, and a Researcher at Lund University’s Centre for Middle Eastern Studies. Her research focuses on land system dynamics, migration, and conflict in the Middle East. Lina is on Twitter @eklund_lina.
This blog was originally posted on Conflict and Environment Observatory (CEOBS)on April 26, 2019. You can find the original via this link.
Leave a Reply