 Today, the Praia City Group on Governance Statistics is launching its Handbook on Governance Statistics. The Praia Handbook on Governance Statistics provides improved data that can assist in the prevention and management of conflicts.
What is the Handbook about?
There have been many attempts to advance governance statistics at different levels, e.g. UNDP’s efforts to support countries’ own governance assessments over the past decade and regional efforts such as the Governance, Peace and Security surveys that form part of the Strategy for the Harmonization of Statistics in Africa (SHaSA), a joint initiative by the African Union Commission, the African Development Bank, UNDP and the UN Economic Commission for Africa.
But the ‘Praia Handbook’ is the first attempt at “conceptualization, measurement methodology and dissemination of governance statistics” that is solidly anchored in the global work of United Nations Statistical Commission, the UN’s body that brings together National Statistical Offices (NSO) from across the globe.
The Praia Group consists of the National Statistical Offices of UN member states and the Norwegian National Statistical Office, SSB, is one if its active members. For the Handbook, the Praia Group has collaborated with a Steering Group made up of UN and other multilateral agencies, academia and civil society, including UNDP, the University of Oslo and the Peace Research Institute Oslo (PRIO). The Handbook covers many areas of Sustainable Development Goal 16 but it goes beyond it. This is important as there is agreement that SDG 16 does not cover governance issues comprehensively.
Why is it so important to advance governance statistics?
There are persistent gaps in governance statistics. Governance statistics are much less developed than statistics in other areas because they are perceived to be technically complex but also cover often opaque activities such as corruption or human trafficking. They also reveal issues at the core of countries’ political systems such as discrimination and are therefore often considered politically sensitive.
Measuring governance will improve governance. And improved governance tends to improve human development. We know that what gets measured gets done. So, measuring things like participation, access to justice or absence of corruption makes it more likely for these aspects to become visible and then improved. For example, as the Handbook points out, governance statistics help to identify groups or sub-groups in the population that are most affected so that policies can be better targeted towards them, as the 2030 Agenda requires in its call for “Leaving No One Behind”. Making people visible allows them to engage as active contributors in the development process, too. The Handbook also explains that governance statistics can contribute to preventing and managing conflict and violence, for example when used as early warning systems.
Data on Political Violence serves as a perfect example. The very successful Millennium Development Goals were largely based on areas for which fairly good data already existed in 2000. The SDGs have been more ambitious and launched a number of targets for which no appropriate data exists. Indicator 16.1.2, “Conflict-related deaths per 100,000 population, by sex, age and cause” is one of them.
The key is the term “Conflict-related”, which is a very wide definition, including everything from direct victims of organized violence to premature fatalities as a result of missing services such as medicines and clean water. In addition, breaking these down by sex, age and cause adds another level to the challenge.
As a response to this challenge, the Office of the High Commissioner for Human Rights has proposed a comprehensive survey methodology that will be implemented by national statistical offices in conflict countries to track all conflict victims.
While we are waiting for these survey data to arrive, we can still analyze some of the data that do exist. Several projects are gathering data on direct conflict fatalities, and have done so for some time. We can therefore already say something about target 16.1.
If we look at the overall trend from the Uppsala Armed Conflict Programme, we see some encouragement.
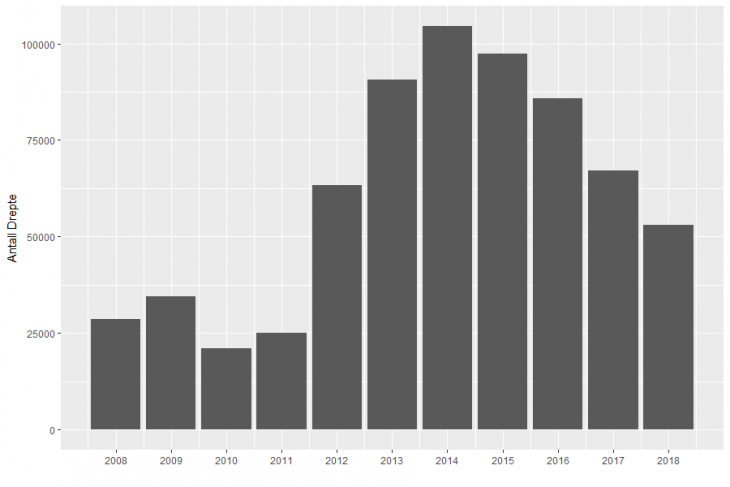 War casualties peaked in 2014 and has steadily decreased in the SDG period. Yet, this is largely because the conflicts in Syria and Iraq became less violent. If we look more closely at how each conflict has developed between 2015 and 2018, we see a much more complex picture.
The bright yellow and orange colors are the conflicts that have gotten worse whereas the blue and purple are those that have become less violent. The red colors are conflicts that have changed very little.
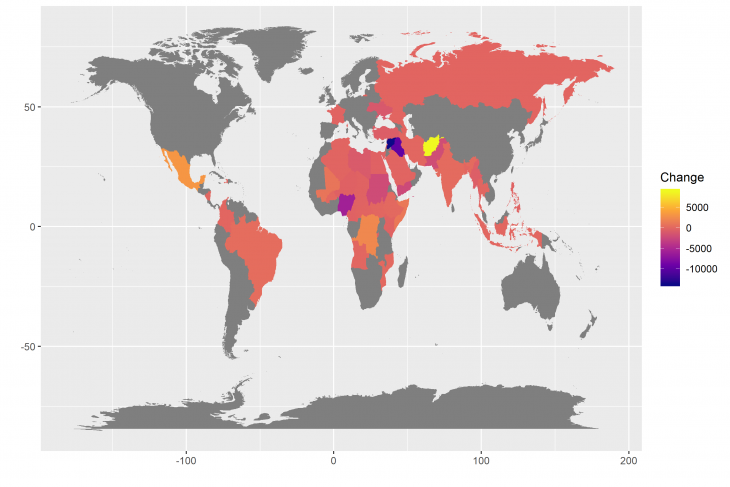 From this we see that Syria, Iraq and Nigeria have had a positive development in the 2015—2018 period, whereas Afghanistan, Mexico and DRC have become more violent.
On a global scale, the time period discussed here seemingly meet the 16.1.2 criteria, but when we look closer we can see that this positive development is mainly driven by a few conflicts. A majority of the conflicts active in this period has not seen a significant reduction in the number of casualties.
Moving forward
The Praia handbook argues that a key challenge going forward in improving data quality and data availability for safety and security is to ensure better coordination of the relevant data providers. This is of particularly importance for data on armed conflict where often, in the midst of war, national institutions will be unable to provide accurate and reliable data. Here, there is a pressing need for international institutions such as the UN to support countries to build data capacities and for the UN, civil society and academics to fill this void while capacities are being built.
- Julia Kercher & Alexandra Wilde work at the UNDP Oslo Governance Centre, Håvard Mokleiv Nygård, at the Peace Research Institute Oslo (PRIO) and Håvard Strand at the University of Oslo.