The Russian invasion of Ukraine on 24 February has led to rapid and large-scale displacement. What do we know about the dynamics of conflict and mobility in Ukraine, and how does conflict exposure impact people’s decisions to stay or to go?
Drawing on new survey data from Ukraine, we shed light on how people are negotiating these choices in the face of the ongoing war.
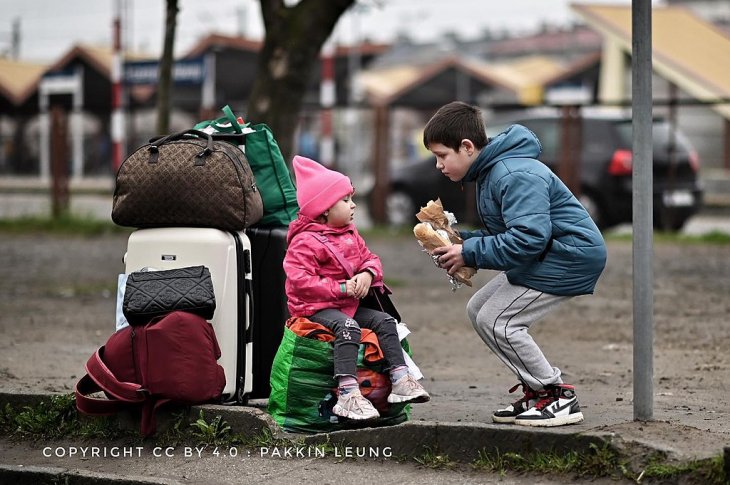
Ukrainian refugees in April 2022. Photo: Pakkin Leung / CC BY 4.0 / Wikimedia Commons
Three months since the Russian invasion of Ukraine, 8 million people have been displaced internally, while 6.3 million people are estimated to be refugees, having crossed out of Ukraine to neighbouring countries. Close to 2 million people are estimated to have crossed back into Ukraine in the same period. This is the most rapid conflict-related displacement – of this scale and speed – that the world has seen for a long time.
As a comparison, the Syrian civil war caused 6.8 million people to flee the country, while 6.7 million remained internally displaced. This happened across a period of several years, and with onward movements toward Europe as one aspect of the broader picture of displacement. In 2011, the number of Syrians internally and internationally displaced constituted about 60% of Syria’s population. By comparison, the proportion of people displaced in the context of the war in Ukraine has exceeded a third of the population.
This comparison is useful for two reasons: first, as a reminder that the displacement dynamics in the face of war in Ukraine are in similar to those seen in other conflict contexts. And second, that the fact that Ukraine is in Europe, and neighbours EU countries, means that the road to safety in an EU country is radically different for Ukrainian refugees than for refugees from conflict settings that do not neighbour an EU member state.
Our survey has generated five key insights into mobility dynamics in the face of war. We report findings from the survey regarding leaving as well as staying, respondents’ plans to stay or to leave current locations, and desired destinations if they were to leave. We look at and compare how men and women navigate these questions, and study the impact of conflict exposure on plans to leave.
The survey was conducted with a representative sample of people in Ukraine, where 811 respondents themselves answered the questions online, on their phones or tablets, in mid-April 2022.
1) Staying, rather than moving?
The survey asked the respondents which oblast (province) they resided in prior to the invasion on 24 February, as well as their current location. By comparing the two, we can calculate the number of respondents that report having left the oblast they lived in prior to the invasion. It should be noted that due to the size of oblasts, many people are likely moving within oblasts, which is not covered in this survey.
Since 24 February 2022, 14.1% of the respondents reported having migrated. This means the vast majority are in fact staying (or may be moving short distances within the oblasts they are in).
The fact that many Ukrainians do not appear to be migrating can likely be associated with the nature of this specific war. It is an invasion, with a general call to mobilization in defence of Ukraine, more so for men (aged 18–60), who are required to stay in the country. It is highly noteworthy that the majority of Ukrainians are staying, especially given both the higher wealth levels in Ukraine than many other countries currently experiencing armed conflict, which might suggest greater access to mobility, and the relative ease of access to neighbouring EU countries, as potential sites of refuge. Further, prior to the conflict, migration aspirations in Ukraine have been relatively high and many have indeed migrated.
Among those respondents who had left their place of residence, 24% reported having gone to another country. A key insight is that three quarters of the respondents who had moved away from their original location since the Russian invasion remain within the territory of Ukraine.
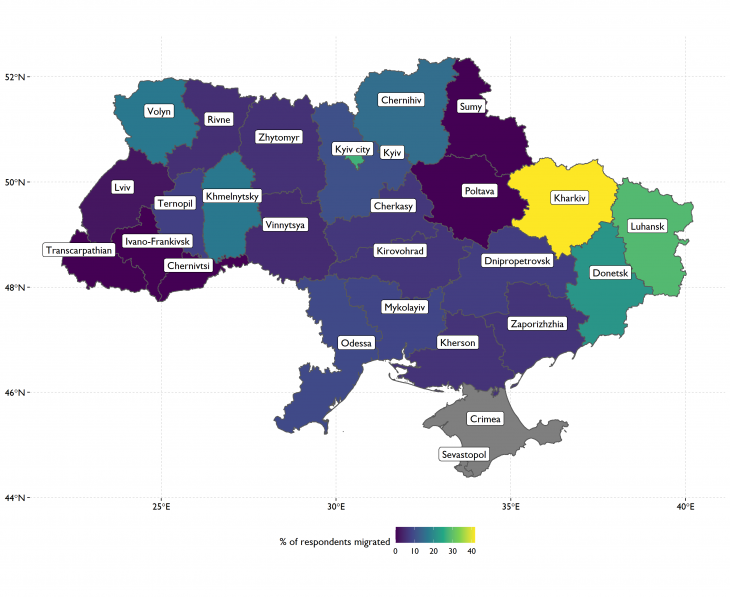
Figure 1. Percentage of respondents per oblast they lived in prior to the invasion but which they have left.
2) Moving to safety?
Of the 14.1% of respondents who had left their home oblast, 24.1% report having travelled abroad, 11.1% to Lviv oblast, and 10.2% to Poltava. Figure 2 shows which oblast the respondents who have migrated are residing in at the time of the survey (April 2022).
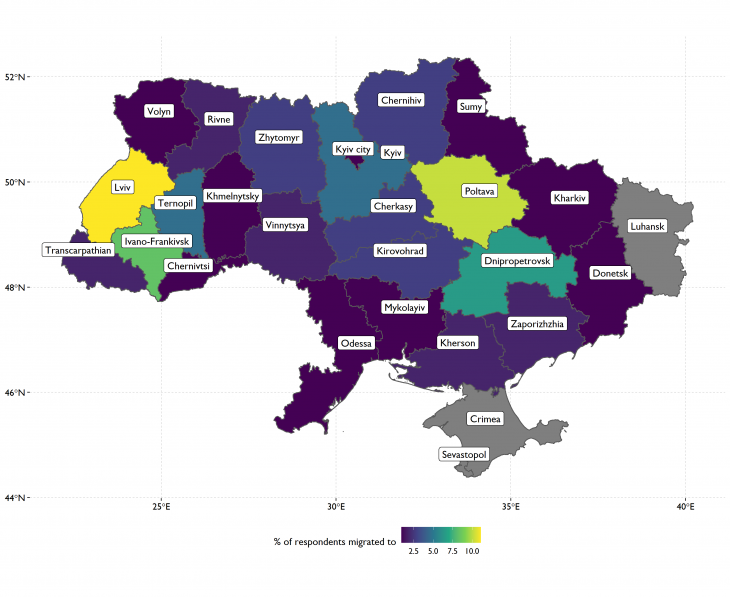
Figure 2. Percentage of respondents per oblast they have moved to since 24 February 2022.
This map shows where the respondents who had moved went. It illustrates some known trends: mainly that people appear to be moving toward safety, notably with relatively more respondents going to Lviv. As in most conflict settings, the majority of displaced people remain within the country – some by preference, others because of other options being out of access. For the respondents in this survey, we do not know why they moved – but we know what they reported about moving.
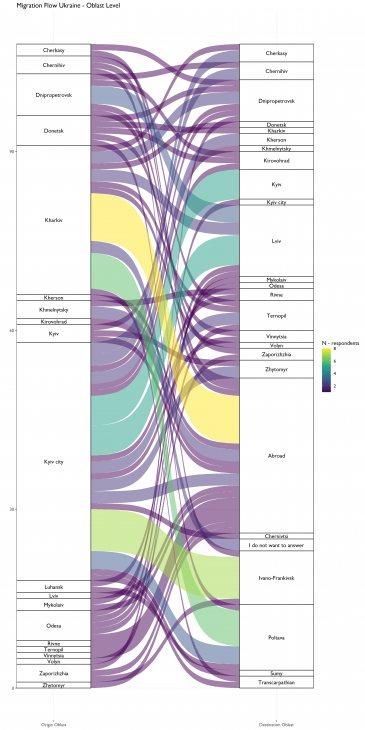
Figure 3: Flowchart showing the movement of the 108 respondents in this survey who had moved from their origin oblast to a different oblast since the outbreak of the war.
The flowchart to the left shows the movement of the 108 respondents in this survey who had moved from their oblast of origin to a different oblast since the outbreak of the war. It thus does not map overall movements within Ukraine, but those of respondents participating in this survey. Meanwhile, the results appear to support information from other sources and underscore the links between particular origin and destination oblasts. Notably, flows from Kiev City to Lviv, or from Kharkiv to abroad. But also from Kiev City to Poltava – perhaps signalling an immediate, short-distance route to relative safety at the time.
This survey did not capture information about return movements, which according to UNCHR data count some 2 million from abroad, but are also significant internally within Ukraine.
3) Most see it as unlikely they will leave, even in the midst of this war
Respondents in the survey were asked how likely they thought it was that they would leave their current location, here understood as the oblast they were currently in, within the next month. Figure 4 shows the distribution of the responses.
Here, the key take-away is the high proportion of respondents who see it as very unlikely that they will leave during the next month. We also note a considerable proportion who see it as neither likely nor unlikely – i.e. who are relatively undecided about this likelihood – and about a fifth of respondents see it as likely to extremely likely that they will leave in the short term (options 5–6–7).
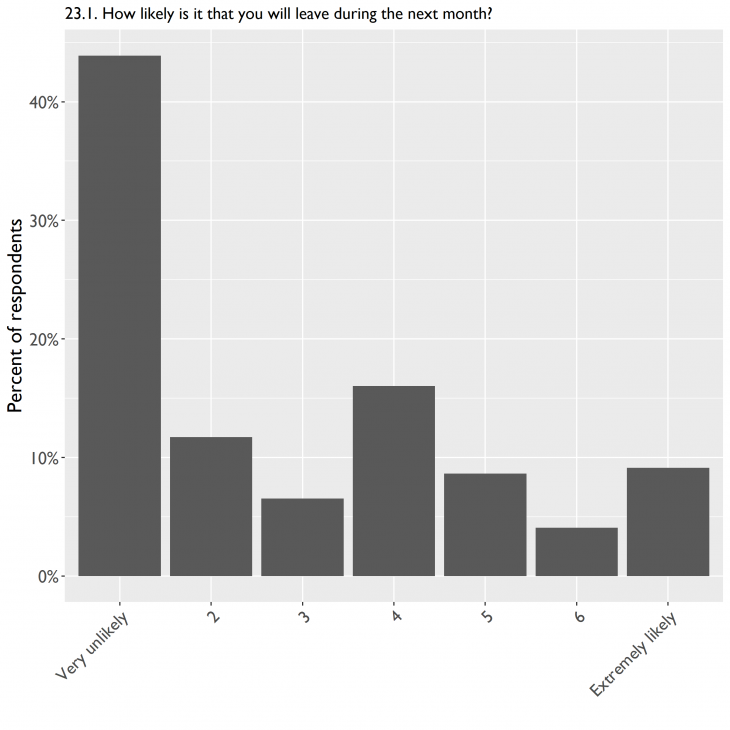
Figure 4
Figure 5 illustrates which regions people want to leave, showing proportions of respondents wanting to leave, by the oblast they were in at the time of this survey. The map shows that it is in the most hard-hit areas that people are more likely to think that it is likely that they will leave, as well as within some of the border areas. This too, however, is set within a broader picture where most people do not think it is likely that they will leave.
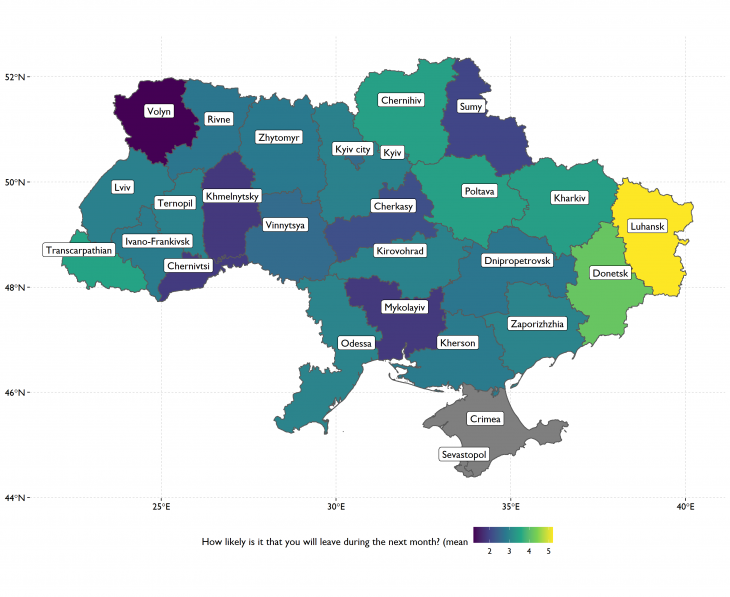
Figure 5
Given that men (aged 18–60) are required to stay in Ukraine, possible gender differences are worth considering, in terms of how likely respondents think it is that they will leave within the next month. Figure 6 suggests that women, compared to men, are slightly more likely to consider leaving. Interestingly, the proportions of men and women who chose the extreme reply option (“extremely unlikely”) were similar.
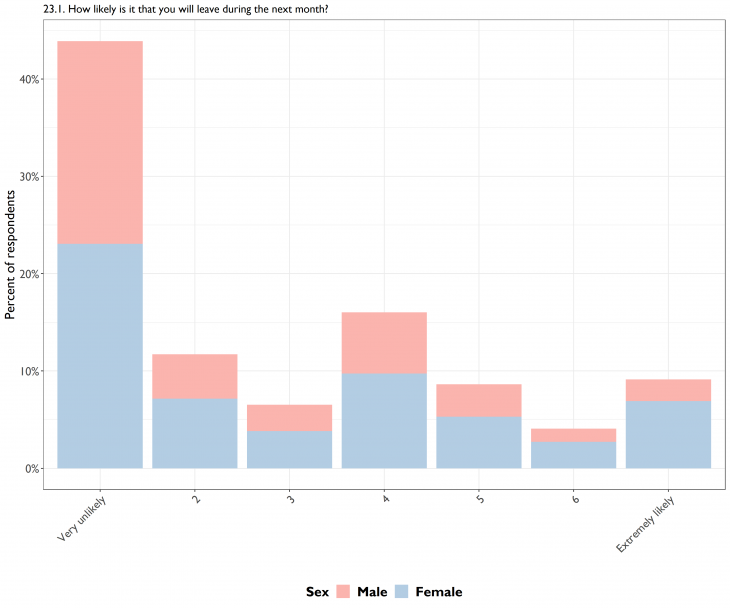
Figure 6
Mobility out of and within conflict-affected areas is known to often be step-wise. It is therefore pertinent to consider how respondents who had already moved perceived the likelihood that they would move (again) within a month of the survey. Figure 7 suggests two possible areas where past mobility in the face of war appears to make a difference. First, slightly smaller proportions report that migration is extremely unlikely, and second, slightly larger proportions report that migration is extremely likely.
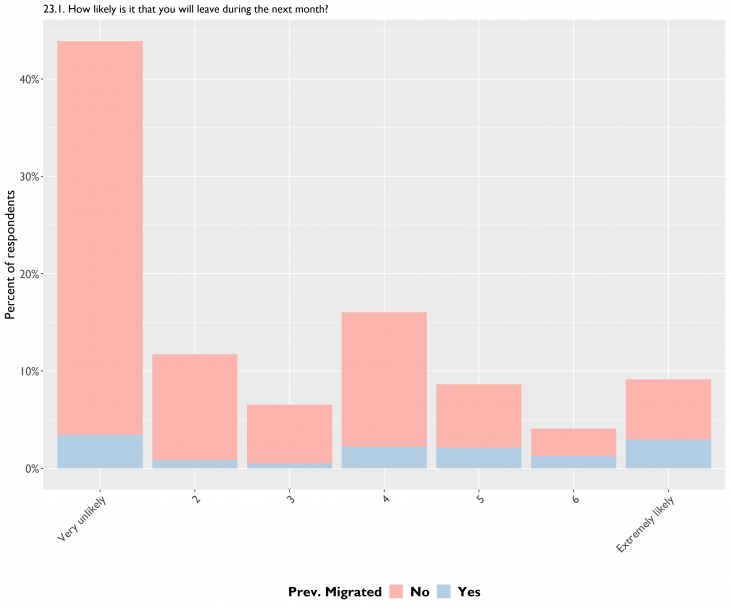
Figure 7
As a caveat, Figure 7 draws on a sub-sample of the 108 respondents who reported having migrated since the invasion on 24 February.
4) If leaving, most want to stay in Ukraine
The survey respondents were also asked where they would go if they were to leave their current location. As Figure 8 shows, more than a third stated that they would go to the neighbouring oblast, or elsewhere within Ukraine, if leaving. Nearly a quarter reported that they would go to Poland, whereas very few reported a desire to go to Russia or Belarus. The other neighbouring countries, Moldova, Romania, Hungary and Slovakia, are all also represented as possible destinations, whereas notably a third of respondents would go to other countries beyond these.

Figure 8
The question ‘where would you go?’ combines both an element of desire and an element of realism – where you would hope to go and where you think it’s possible to go. Responses largely reflect patterns that are both confirmed in the actual patterns of mobility within and out of Ukraine since the Russian invasion and reflect mobility-dynamics in other conflict-settings. These reflect a mix of internal mobility or displacement, moving across the closest border, and moving further afield geographically. We do not have data about which countries are included by respondents, beyond those listed, but one can anticipate these would include countries such as Turkey and Germany, as well as other EU countries further south, west and north of those bordering Ukraine.
5) Conflict exposure, moving and staying
To explore the impact of the war itself on potential staying or leaving, we model how likely it is that a respondent will leave during the next month. This is based on questions where respondents report whether they have been directly attacked by invading Russian or pro-Russian forces (me or my property targeted using firearms, artillery, or other weapons). The results show that conflict significantly increases the likelihood of the respondent wanting to leave (by 19%, from an average of 2.7 for respondents not exposed to conflict to 3.3 after exposure, see fig 9 below). We also explored the effects of the respondent’s family or friends being targeted, but that did not significantly affect individuals’ reported likelihood of leaving.
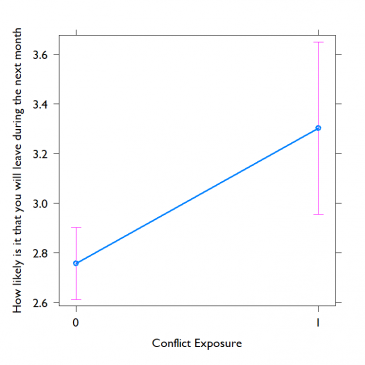
Figure 9
The likelihood of leaving is measured on a scale from 1 to 7, where 1 is very unlikely, and 7 is extremely likely. The model controls for respondents’ sex, socioeconomic status, migration history and recent movement.
Our five insights from the analysis of this survey data underscore how many people in Ukraine both have – and are planning – to stay where they are (or within their oblast). Meanwhile, displacement happens internally, at a higher rate than abroad, and those who think it is likely they will move, plan to remain within Ukraine. However, moving out of harms way appears to be important, as patterns of mobility westward in Ukraine illustrate. Being personally exposed to the violence of war, meanwhile, appears to be a clear marker of increased likelihood of plans to move in the short term.
These findings support insights from actors on the ground in Ukraine and at its borders. Significantly, it also offers a picture of conflict-mobilities that can be followed day by day, and which in many respects resemble dynamics known from conflict contexts globally: high rates of cross-border mobilities in-and-out of a country at war, including return movements, most mobility within country, often local, and many people staying put.
About the survey
The current blog post is based on data that were collected as part of a larger project that interviewed Ukrainians over two survey waves (i.e., panel surveys). The first survey wave was conducted between 9 and 12 March 2022 and the second between 3 and 11 April 2022. Both waves were administered online in Ukrainian and Russian by the local survey agency Info Sapiens. The survey agency aimed to generate a representative sample of the Ukrainian population between 18 and 55 years old, in settlements with a minimum of 50,000 residents. A total of 1,081 people were interviewed in the first survey wave, and 811 were reinterviewed in the second wave.
The survey could not reach part of the Ukrainians who left the country and no longer used Ukrainian SIM cards, but it could reach those who did – or who responded using an email account. Some people who resided in areas of intense fighting were also not reached (as they could not have access to internet and of could not use their phones).
This blog post is based on the second survey wave (some analyses of the first wave are presented in the PRIO blog post: Henrikas Bartusevicius (PRIO), Honorata Mazepus & Florian van Leeuwen ‘Will Terror Deter or Motivate Ukrainian Resistance? Survey Evidence from Besieged Ukraine’, 26 March 2022). The statistics presented above were generated using sampling weights to represent population patterns.
The analysis and opinions in this summary and the blog should only be attributed to the authors. We thank Honorata Mazepus and Henrikas Bartusevičius for helpful comments.
The first survey wave was supported by the Alexander-von-Humboldt prize to Mark van Vugt, and the second wave was supported by the Peace Research Institute Oslo (PRIO). The following scholars were involved in designing the first wave: Henrikas Bartusevičius (PRIO), Lasse Lausten (Aarhus University), Honorata Mazepus (Leiden University), Florian van Leeuwen (Tilburg University), and Mark van Vugt (Vrije Universiteit Anmsterdam). The second wave was designed by the same five scholars, plus the following scholars from PRIO: Pavel Baev, Helga Malmin Binningsbø, Marta Bivand Erdal, Haakon Gjerløw, Nic Marsh, Louise Olsson, Gudrun Østby, Ida Rudolfsen, Siri Aas Rustad, Andreas Forø Tollefsen, Henrik Urdal, and Torunn L. Tryggestad.
The writing and analysis of this blog post are funded by the CONMIG project.
Appendix
Number of respondents per pre-invasion oblast:
| Pre-Invasion oblast | N respondents |
| Cherkasy | 31 |
| Chernihiv | 20 |
| Chernivtsi | 12 |
| Dnipropetrovsk | 95 |
| Donetsk | 23 |
| Ivano-Frankivsk | 23 |
| Kharkiv | 60 |
| Kherson | 17 |
| Khmelnytsky | 18 |
| Kirovohrad | 16 |
| Kyiv | 29 |
| Kyiv city | 149 |
| Luhansk | 7 |
| Lviv | 49 |
| Mykolaiv | 23 |
| Odesa | 54 |
| Poltava | 31 |
| Rivne | 19 |
| Sumy | 20 |
| Ternopil | 13 |
| Transcarpathian | 8 |
| Vinnytsia | 21 |
| Volyn | 6 |
| Zaporizhzhia | 49 |
| Zhytomyr | 18 |
Number of respondents per current oblast
| Current oblast | N respondents |
| Abroad | 26 |
| Cherkasy | 32 |
| Chernihiv | 20 |
| Chernivtsi | 13 |
| Dnipropetrovsk | 95 |
| Donetsk | 19 |
| I do not want to answer | 2 |
| Ivano-Frankivsk | 32 |
| Kharkiv | 36 |
| Kherson | 18 |
| Khmelnytsky | 16 |
| Kirovohrad | 18 |
| Kyiv | 31 |
| Kyiv city | 110 |
| Luhansk | 5 |
| Lviv | 60 |
| Mykolaiv | 22 |
| Odesa | 50 |
| Poltava | 42 |
| Rivne | 20 |
| Sumy | 21 |
| Ternopil | 17 |
| Transcarpathian | 10 |
| Vinnytsia | 22 |
| Volyn | 6 |
| Zaporizhzhia | 48 |
| Zhytomyr | 20 |